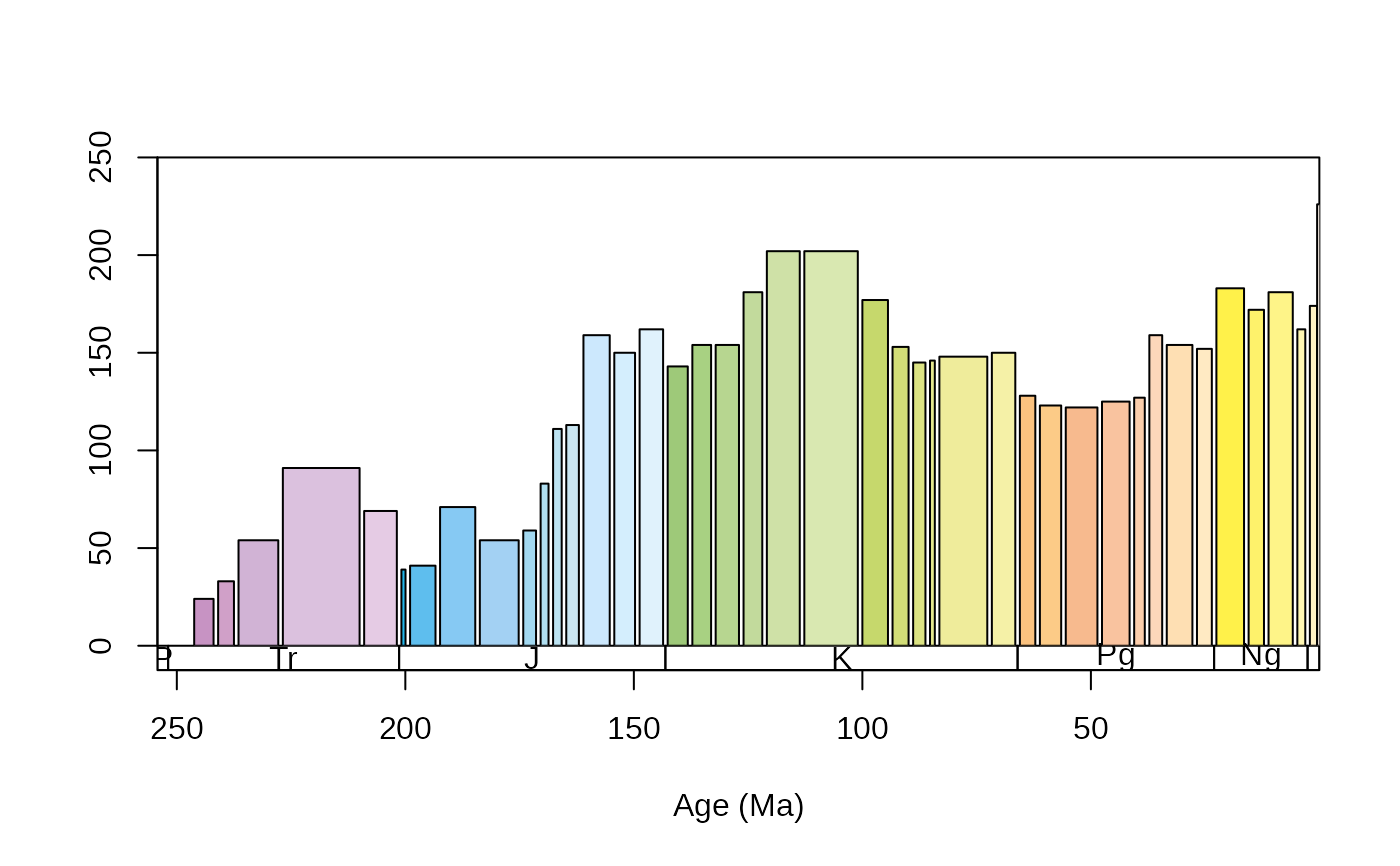
Function to plot a series a values with bars that have variable widths
Source:R/plotting.R
tsbars.RdFunction to use bars for time series.
Arguments
- x
(numeric)Vector specifying where the centers of the bars should be on the x axis.- y
(numeric)Vector containing the heights of the bars.- width
(numeric)Vector containing the widths of the bars. Recycling is not supported, has to be either a single numeric value, or a numeric vector with the same length asxandy. Automatic width calculation is possible, the default"max"option sets the bar width even and equal to the the maximum width that can be used evenly witout causing overlaps. The option"half", places the boundaries of the bars halfway between the points. This will make the bars' width asymmetrical around thexcoordinates.- yref
(numeric)Single numeric value in the y dimension indicating common base for the bars.- gap
(numeric)The amount of gap there should be between the bars (in the unit of the plotting). Defaults to no gaps.- vertical
(logical)Switching this option toFALSEwill reverse the x and y dimensions of the plot.- ...
Arguments passed to
rect.
Details
People often present time series with connected points, although the visual depiction implies a certain process that describes how the values change between the points.
Instead of using simple scatter plots, Barplots can be used to describe series where a single value is the most descriptive of a discreet time bin. The tsbars() function
draws rectangles of different widths with the rect function, to plot series in such a way.
