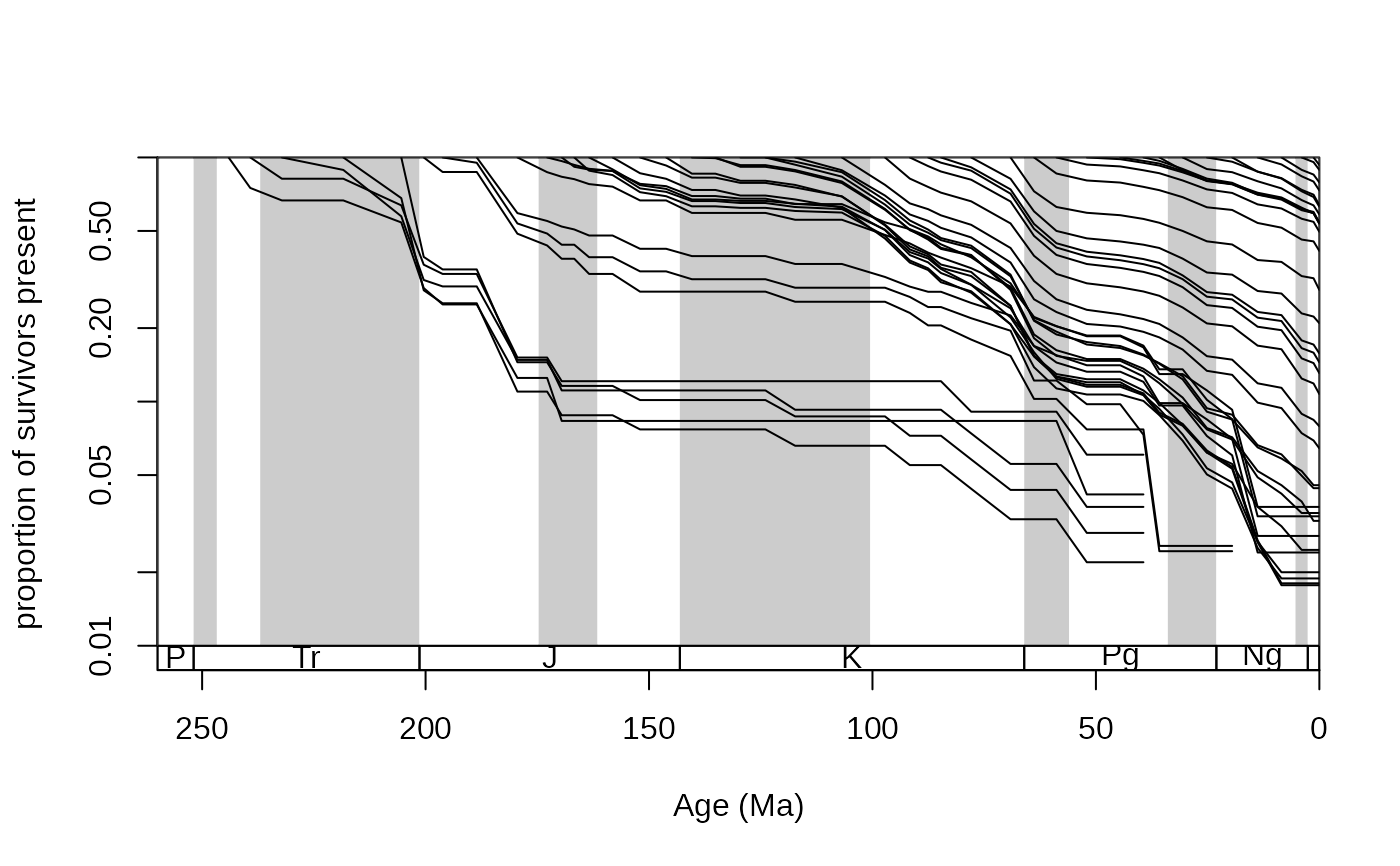
This function will calculate both forward and backward survivorship proportions from a given occurrence dataset or FAD-LAD matrix.
Arguments
- x
(data.frame)The data frame containing fossil occurrences.- tax
(character)The variable name of the occurring taxa (variable type:factororcharacter).- bin
(character)The variable name of the time slice numbers of the particular occurrences (variable type:numeric). Bin numbers should be in ascending order,can containNAs, it can start from a number other than 1 and must not start with 0.- method
(character)Either"forward"or"backward".- noNAStart
(logical)Useful when the dataset does not start from bin1. ThennoNAStart=TRUEwill cut the first part of the resulting table, so the first row will contain the estimates for the lowest bin number.- fl
(matrixordata.frame). If so desired, the function can be run on an FAD-LAD dataset, output by thefadladfunction.
Details
Proportions of survivorship are great tools to visualize changes in the composition of a group over time (Raup, 1978). The curves show how a once coexisting set of taxa, called a cohort, loses its participants (forward survivorship) as time progress, or gains its elements as time is analyzed backwards. Each value corresponds to a cohort in a bin (a) and one other bin (b). The value expresses what proportion of the analyzed cohort (present together in bin a) is present in bin b.
References:
Raup, D. M. (1978). Cohort analysis of generic survivorship. Paleobiology, 4(1), 1-15.

